One option is to use PhpMyAdmin Designer (find it in the top menu of PMA) that creates a quite interesting visualization of the tables, but if the tables are a lot it doesn’t work as expected when you export the pdf or the svg file.
Another very interesting solution is to use MySQL Workbench, a very powerful tool build directly from Oracle.
First of all download the tool and setup the connection to your database and then access it.
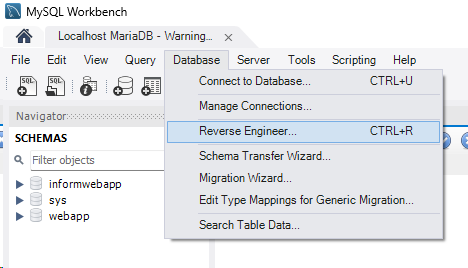
Now click on Database > Reverse Engineer
You have now to select the database you want to analyze from the dropdown menu and follow the wizard.
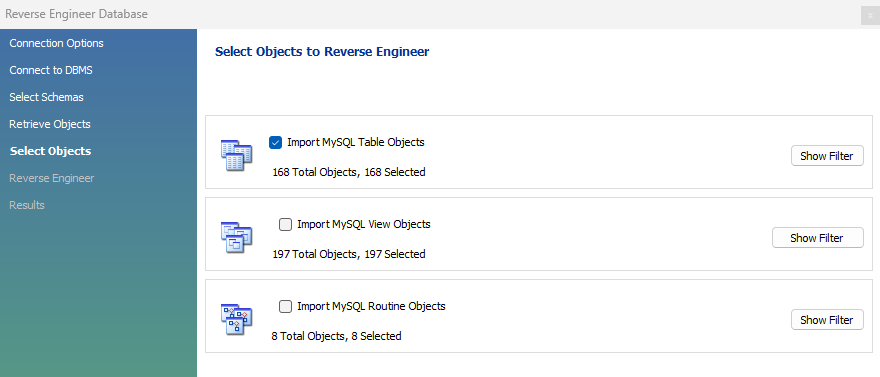
After some steps you are requested to select which type of object the tool has to analyze
You can click on “Show filter” to exclude specific tables and run the analysis on a selected set of obects.
Then click on “Execute” and proceed to the last wizard page
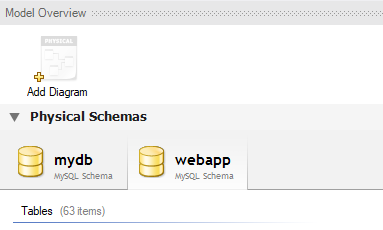
At this point we can start the creation of the diagram. Double click on “Add diagram”
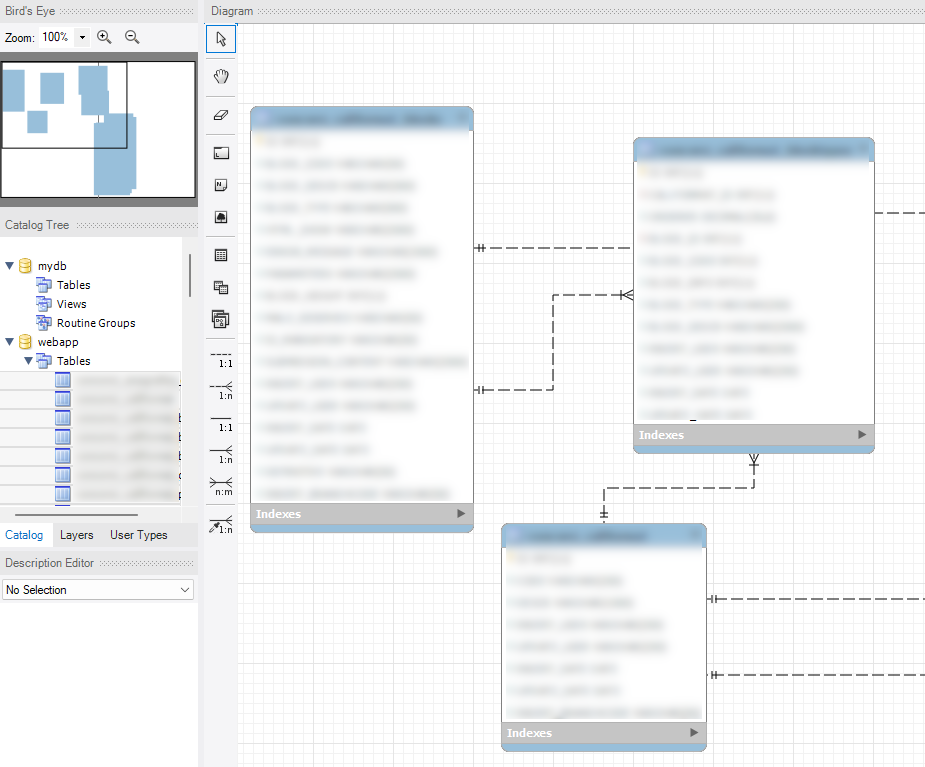
On the left side panel, open the Tables, select all teh tables you want and drag and drop into the main canvas.
The tables and the relations will be created:
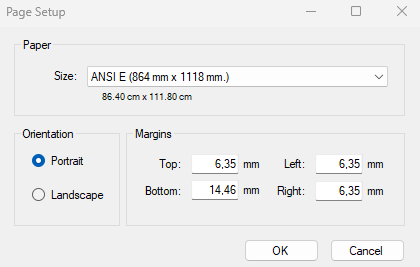
To change the size of the canvas click on File > Page Setup and select the desired dimension, then apply.
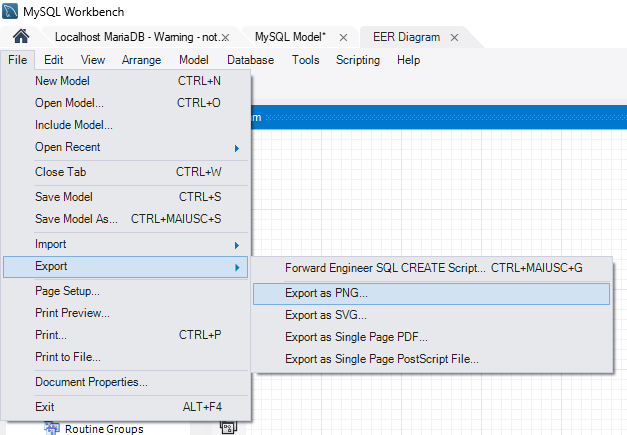
Arrange all the tables and then you are ready to export the graph, Click in File > Export and select the output format:
If you want to save also the model to edit it later, click on File > Save Model.
Cheers

 This work is licensed under a
Creative Commons Attribution-NonCommercial 4.0 International License.
